How Nations Capture Economic Value
The countries that design things earn more than the countries that build them. Here's why that gap compounds.
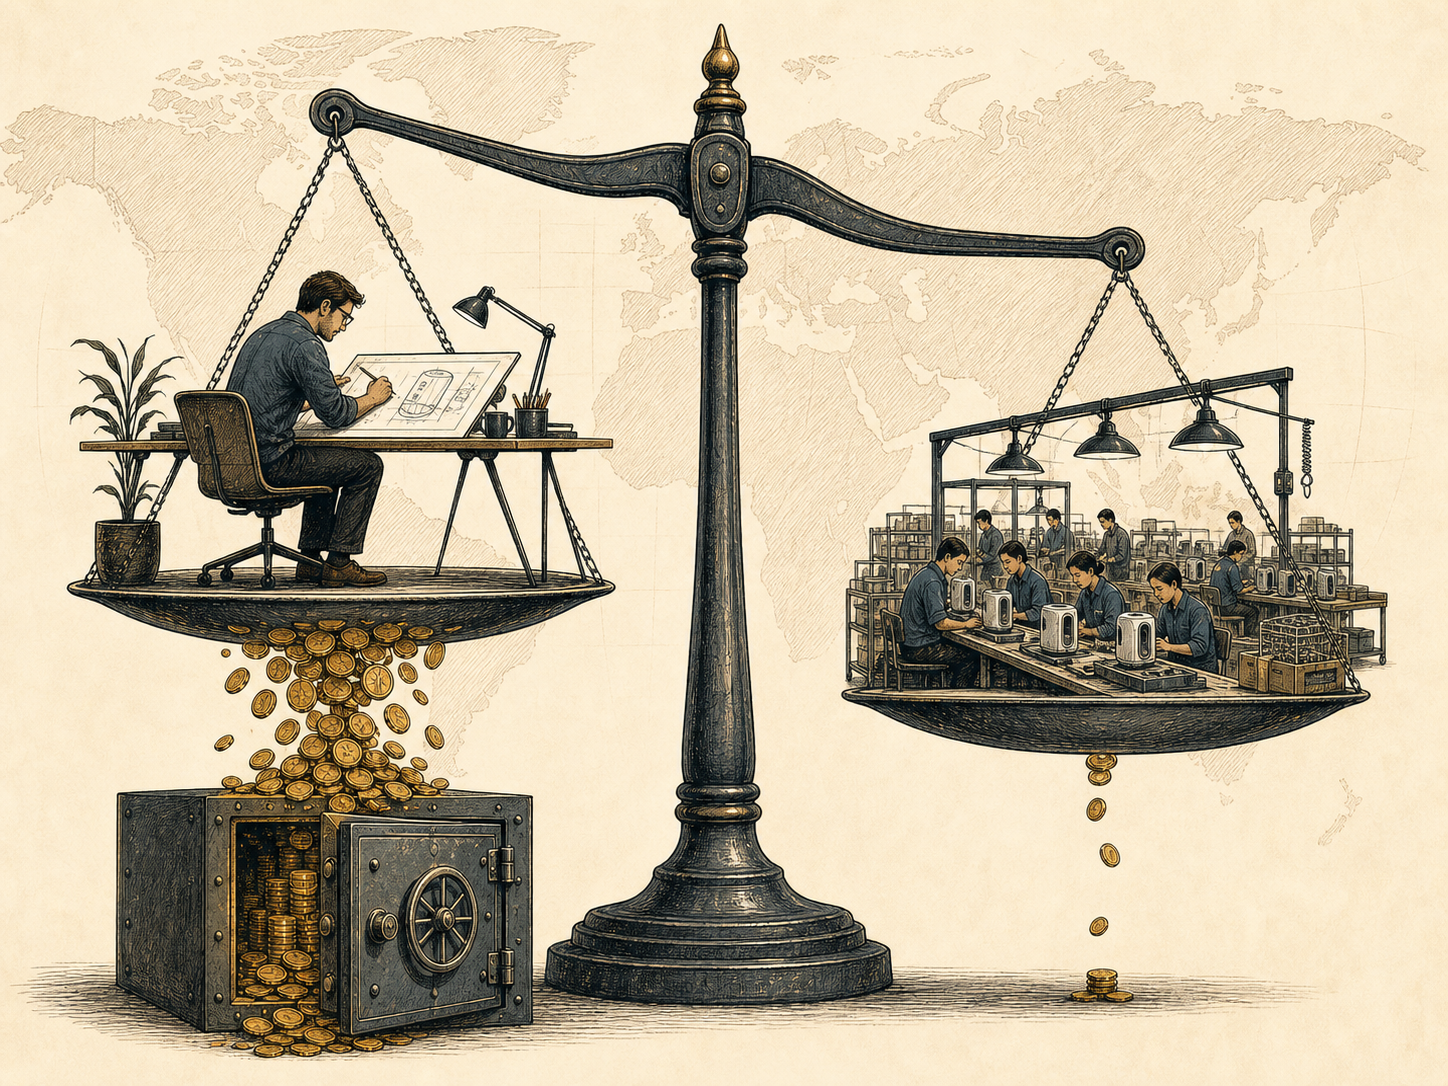
The country that designs a product almost always earns more than the country that builds it.
Take the iPhone. Apple spends roughly $31.4 billion a year on R&D — designing the product, building prototypes, and figuring out manufacturing in Cupertino before a single unit ships.1 Manufacturing is then distributed to the most cost-effective geographies: TSMC in Taiwan for semiconductors, South Korea and China for components, and increasingly India for final assembly. The finished product ships worldwide. Apple’s sales, marketing, and logistics networks handle the last mile.
Most of the labour is in assembly and dispatch. Most of the value is in design. Dedrick, Kraemer, and Linden (2010) estimated that Apple captures roughly $321 of profit on every iPhone sold at the time of their study — while the assembler, Foxconn, earns around $10.2
This isn’t arbitrary. Designing a product is harder to replicate than manufacturing it at scale — and the distribution of value across the supply chain reflects that. Apple’s profits flow to the US, not to the countries where the phone is built.
The same logic scales up from firms to nations. The Democratic Republic of Congo produces around 70% of the world’s cobalt — yet exports it almost entirely as raw ore, capturing only a sliver of the value embedded in the finished battery cells and electric vehicles it ultimately enables.3 A country that mines cobalt and ships it raw earns a fraction of what the country that designs the battery earns.
Nations — and the firms within them — that move up the complexity ladder tend to capture a larger share of the value they help create. The evidence for this is formalized in the Economic Complexity Index, developed by Hidalgo and Hausmann (2009), which ranks countries by the diversity and sophistication of their export baskets and consistently finds that high-complexity exporters grow faster over the long run.4
The implication is not that manufacturing is worthless — every link in the chain is necessary. It is that the link which is hardest to replicate extracts the most value, and building an economy around replicable links is a structural disadvantage that compounds quietly over decades.
-
Apple Inc., Form 10-K, Fiscal Year 2024 (ended September 28, 2024). R&D expense: $31.4B.
-
Dedrick, J., Kraemer, K. L., & Linden, G. (2010). “Who profits from innovation in global value chains? A study of the iPod and notebook PCs.” Industrial and Corporate Change, 19(1), 81–116.
-
USGS Mineral Commodity Summaries 2024: DRC accounted for approximately 70% of global cobalt mine production in 2023. Value-add data: Cobalt Institute, State of the Cobalt Market Report,
-
Hidalgo, C. A., & Hausmann, R. (2009). “The building blocks of economic complexity.” Proceedings of the National Academy of Sciences, 106(26), 10570–10575.